Juan Manuel Campanario
Side Projects
During my limited free time, I enjoy creating new datasets and highlighting new insights about topics.
McDonalds Locations
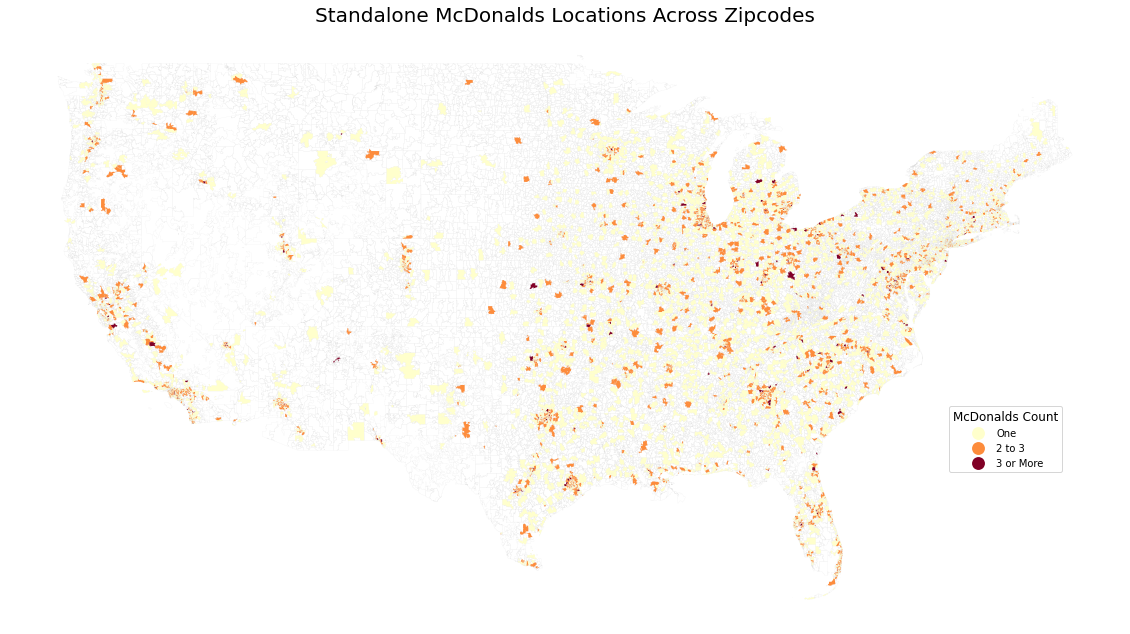
In the car with a friend, she said it would be cool to be able to make maps of store fronts. I decided to spend time between graduating and starting my first job writing code to do exactly that for McDonalds. The code will be posted soon, but for now click here to download the resulting map.
Here is the png version:
MMA Fights
During the pandemic, I started to watch a lot of UFC events. I realized that there wasn’t really any time series data. Most statistics would be about individual fighters, telling us about their personal records. I decided I wanted to change that. I wrote a script to scrape Sherdog tables related to all fighters. Sherdog has data on all professional fighters, with tables recording information about fights during their careers. For example, on Daniel Cormier’s page, we know the opponent, the event, the date, the result, how the fight ended, the duration, and the referee for each of his professional fights.
You can click here to read a short essay about what I learned.
Forecasting Demand for Neonatal & Maternal Services
Understanding how demand for services change over time is essential to policy makers. Whether it be polling stations, bus stops, or hospital services, predicting which locations will see the largest growth in demand allows policy makers to direct funds to areas that will be most in need. In this short project, I focus on the demand for neonatal and maternal services.